
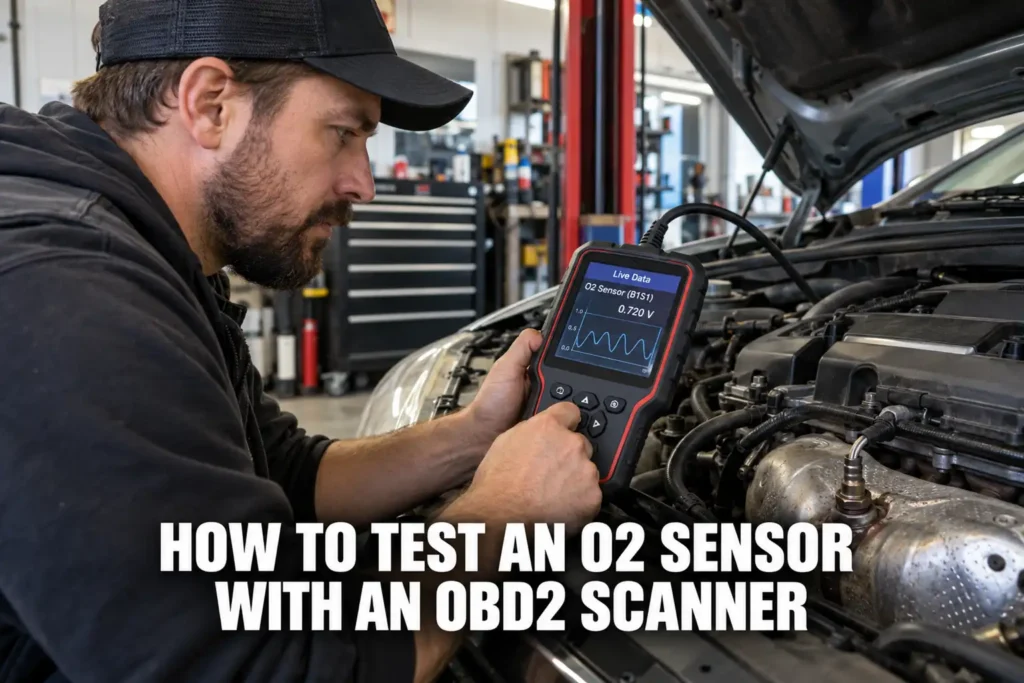
How to Test an O2 Sensor with an OBD2 Scanner: Live Data, Mode 6, and DTCs Explained
By Kamil Siegień / October 12, 2026
An OBD2 scanner gives you direct access to your oxygen sensor data without removing or touching the sensor itself. The scanner reads live sensor voltage, switching frequency, heater circuit status, and response time through Mode 1 and Mode 6, and the resulting numbers tell you whether the sensor is working, slow, or failed before you spend money on parts. Most failed sensors announce themselves clearly in the live data long before the ECU stores a confirmed DTC.
My obd2 modes explained modes 1 through 10 covers this step by step.
Chevy owners looking for the right scanner should check my best diagnostic tools for Chevy.

About the author: Hello! I’m Kamil Siegień, founder of OBD2 Scout. My diagnostic experience started with an engine rebuild on a 2014 Skoda Superb 1.8 TSI, where tuning from 160 to 222 hp required mastering live data and ECU behavior that basic code readers cannot handle. I am a former BMW and MINI employee and regularly use diagnostic scanners on my own Audi A4 2.0 TFSI.
This guide covers what the ECU measures on each sensor bank, how to read narrowband and wideband O2 sensor live data, what a normal switching pattern looks like versus a slow or failed one, how to interpret Mode 6 O2 sensor results, and what the DTC ranges tell you about which sensor failed and how.
My my guide on read o2 sensor live data covers this step by step.
How Many O2 Sensors Your Car Has and Where They Are
Most 4-cylinder engines have two oxygen sensors: one upstream (before the catalytic converter, also called Bank 1 Sensor 1) and one downstream (after the catalytic converter, also called Bank 1 Sensor 2). V6 and V8 engines typically have four sensors: Bank 1 Sensor 1, Bank 1 Sensor 2, Bank 2 Sensor 1, and Bank 2 Sensor 2. Bank 1 is the bank containing cylinder 1. Bank 2 is the opposite bank.
For scanner recommendations to perform this type of work, see my top picks for the best scanners.
The upstream sensors (Sensor 1 on each bank) are the primary control sensors. They feed voltage data to the ECU continuously, and the ECU uses that data to adjust fuel delivery in real time. The downstream sensors (Sensor 2 on each bank) are the catalyst monitor sensors. Their primary job is to confirm the catalyst is converting exhaust gases, not to control fueling directly. Testing procedures differ between upstream and downstream sensors because their normal operating patterns are different.
If you are on a tight budget, my top budget scanner picks covers the top value picks.
Some modern vehicles replace the upstream narrowband sensor with a wideband air-fuel ratio (AFR) sensor. Wideband sensors produce different output data than narrowband sensors and require a different interpretation approach. The PID labels in the scanner reveal which type you have: narrowband PIDs show “O2S Voltage” in the 0 to 1.275 volt range, while wideband PIDs show “O2S Wide Range” or AFR values expressed as a lambda ratio or air-fuel ratio number.
My a pid obd2 diagnostics explained covers this step by step.
If you prefer a wireless setup, my best Bluetooth diagnostic tools covers the best options.
Narrowband O2 Sensor: What Normal Live Data Looks Like
A healthy upstream narrowband oxygen sensor switches continuously between approximately 0.1 volts (lean) and 0.9 volts (rich) while the engine runs at normal operating temperature in closed-loop. The ECU uses this signal to maintain the stoichiometric air-fuel ratio of 14.7:1. Normal switching rate is roughly 0.5 to 2 complete cycles per second at steady idle after warm-up. The sensor must cross the 0.45 volt midpoint on every complete switch cycle.
iPhone users looking for a compatible scanner can check my top iOS diagnostic tools.
To read this in live data, navigate to your scanner’s Mode 1 data stream and select the O2 sensor PIDs. The relevant PID identifiers are: O2S11 (Bank 1 Sensor 1), O2S12 (Bank 1 Sensor 2), O2S21 (Bank 2 Sensor 1), O2S22 (Bank 2 Sensor 2). The values update at the scanner’s polling rate, typically 4 to 10 times per second depending on the scanner model and CAN bus speed.
Watch the upstream sensor voltage for 60 to 90 seconds at a stable idle after the engine reaches full operating temperature (coolant at 195 to 210°F). A working sensor shows active, continuous oscillation: the value rises toward 0.9, then drops toward 0.1, then rises again. The transitions happen quickly. The sensor should not sit at a fixed voltage for more than a second or two except when starting from cold. If the voltage is fixed or moving very slowly, the sensor is slow or failed.
Toyota owners looking for the right scanner should check my best diagnostic tools for Toyota.
Recognizing a Slow or Lazy O2 Sensor in Live Data
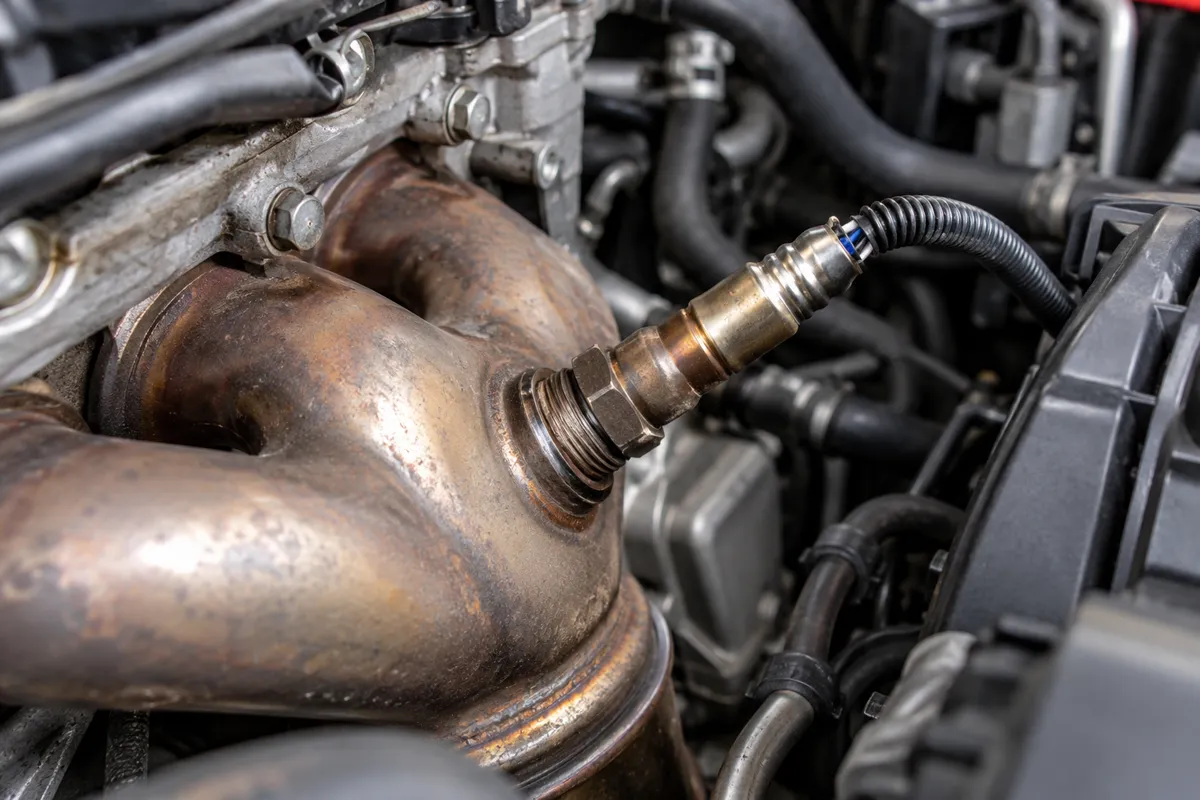
A lazy oxygen sensor still switches between rich and lean but does so too slowly. Instead of 0.5 to 2 complete cycles per second, a lazy sensor might complete only 0.1 to 0.2 cycles per second. The voltage transitions are sluggish: you watch it slowly climb toward 0.8, then slowly fall toward 0.2 over 8 to 10 seconds instead of 1 to 2 seconds. The ECU detects this slow response and stores a P0136 or P0141 (slow response) DTC, but a borderline sensor may not yet trigger a confirmed code.
Mercedes owners looking for the right scanner should check my best diagnostic tools for Mercedes.
The switching rate is visible in the live data graph on scanners that display graphing mode. On scanners that only show numerical values, count how many full cycles (high to low to high) occur in 30 seconds. More than 15 cycles in 30 seconds is healthy for most vehicles. Fewer than 5 cycles in 30 seconds indicates a slow sensor. Exactly 0 cycles means the sensor is either not switching at all or is not warming up properly.
Short-term fuel trim (STFT) also shows a lazy sensor indirectly. When the upstream sensor is slow, the ECU cannot correct fueling fast enough, and STFT oscillates in wide swings rather than staying within plus or minus 5% of zero. A healthy engine with a good upstream sensor shows STFT values that oscillate within a narrow band. A lazy sensor produces STFT swings of plus or minus 10% or more as the ECU overcorrects for each slow sensor transition.
My my guide on stft vs ltft read fuel trims covers this step by step.
Honda CR-V owners can find the right scanner in my top diagnostic tools for the CR-V.
Downstream O2 Sensor: What Normal Looks Like
The downstream sensor on a healthy catalyst should be relatively stable, hovering around 0.5 to 0.65 volts with slow, minor fluctuations. Unlike the upstream sensor, it should not switch rapidly between 0.1 and 0.9 volts. The catalyst’s chemical conversion process averages out the rich and lean pulses from the upstream sensor, so the downstream sensor sees a stabilized, averaged exhaust gas composition.
Audi owners looking for the right scanner should check my best diagnostic tools for Audi.
If the downstream sensor switches actively at the same rate as the upstream sensor, it means the catalyst is no longer averaging the exhaust stream effectively and is passing unprocessed exhaust gases. This is the primary catalyst efficiency test that the ECU runs during its catalyst monitor, and it is what stores a P0420 (Catalyst System Efficiency Below Threshold, Bank 1) or P0430 (Bank 2) code.
Honda owners looking for the right scanner should check my best diagnostic tools for Honda.
A downstream sensor stuck at 0.1 volts indicates a perpetually lean signal, which can mean a failed sensor, an exhaust leak between the catalyst and the sensor, or a severely failed catalyst that is no longer producing enough oxygen storage effect. A downstream sensor stuck at 0.85 volts or higher indicates a perpetually rich signal, which is less common and usually points to a failed sensor rather than a catalyst issue.
Audi Q8 owners can find the right scanner in my top Q8 diagnostic tools.
Wideband (AFR) Sensor: Reading Lambda Values
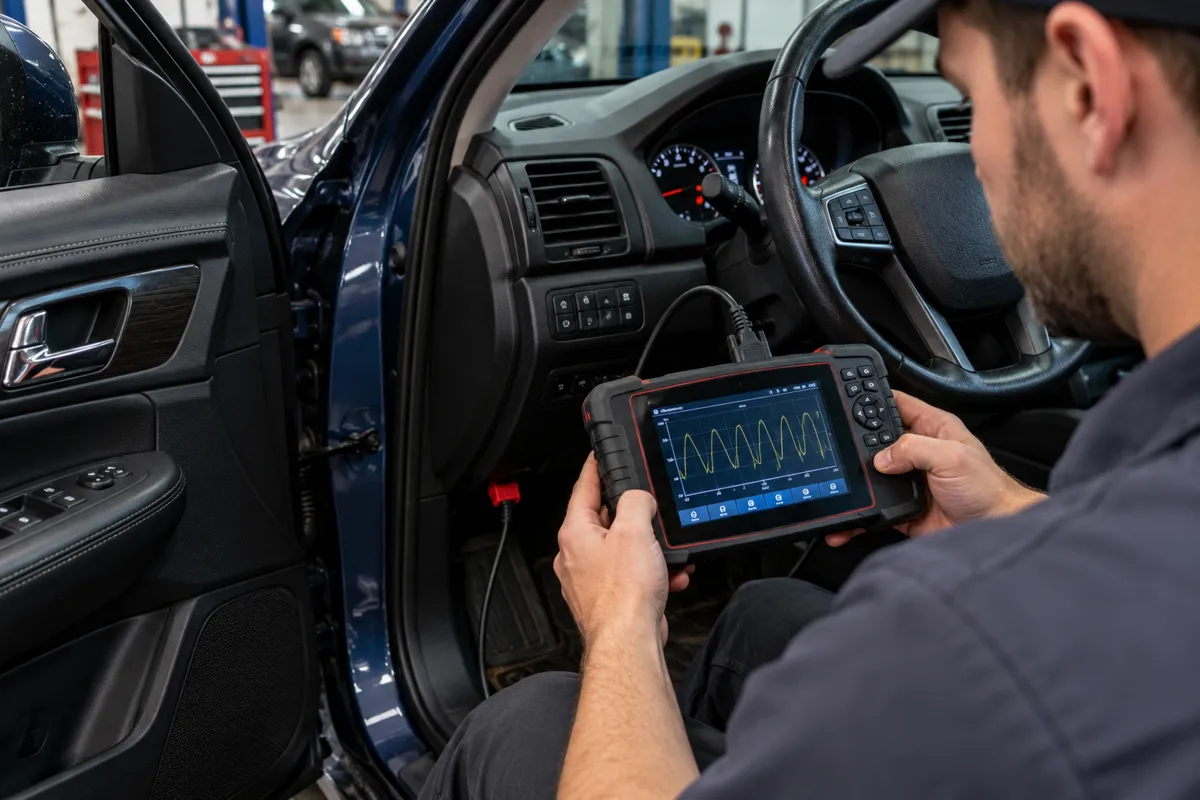
Wideband sensors, used as upstream sensors on many vehicles from 2005 onward, output a lambda value or air-fuel ratio number rather than a simple 0 to 1 volt signal. Lambda 1.0 equals stoichiometric (14.7:1 air-fuel ratio). Lambda below 1.0 means the mixture is rich. Lambda above 1.0 means the mixture is lean. Scanners display wideband data as either a lambda value (e.g., 0.97, 1.03) or as an equivalence ratio.
BMW owners looking for the right scanner should check my best diagnostic tools for BMW.
In normal closed-loop operation, a wideband upstream sensor shows values cycling tightly around lambda 1.0, typically between 0.97 and 1.03. Wide swings below 0.90 or above 1.10 that persist for more than a few seconds indicate fueling control problems rather than sensor failure. A wideband sensor that outputs a fixed lambda value (no variation at all) or a fixed voltage on the raw wire reading is typically failed.
Ford owners looking for the right scanner should check my top Ford scanner picks.
Wideband sensors require a control module to convert their raw current signal to the lambda value the scanner reads. A wideband sensor failure often includes the heater failing first, which causes the control module to report an out-of-range signal. The DTCs are in the P0135 to P0167 range and P2195 to P2199 range depending on the specific failure mode.
Audi Q7 owners can find the right scanner in my top diagnostic tools for the Q7.
O2 Sensor Heater Circuit Test via Live Data
All oxygen sensors on OBD2-compliant vehicles have an integrated heater element. The heater brings the sensor to operating temperature (approximately 600°F / 315°C) within 20 to 30 seconds of startup, before exhaust heat alone would warm it. Without the heater, a cold engine takes several minutes in open-loop before the sensor reaches operating temperature. The heater enables closed-loop operation sooner, which reduces cold-start emissions.
I cover this capability in more detail in my BlueDriver Pro deep dive.
The heater circuit is monitored by the ECU as a separate system from the sensor voltage. Mode 1 includes a PID called “O2 Sensor Heater” or “O2 Sensor Heater Duty Cycle” that shows the percentage of time the ECU is energizing the heater. At cold start, heater duty cycle is typically 70 to 100%. After the sensor reaches operating temperature, duty cycle drops to a maintenance level of 30 to 60%, cycling to maintain temperature without overheating the sensor. A heater duty cycle stuck at 0% after a cold start indicates a failed heater element or circuit.
The heater current draw can also be checked indirectly with a Mode 6 test on scanners that support it. Heater circuit DTCs appear in the P0030, P0031, P0032, P0036, P0037, P0038 ranges (Bank 1 Sensor 1 and Sensor 2 heater). A P0031 or P0037 indicates low voltage on the heater circuit (open heater element or blown fuse). A P0032 or P0038 indicates high voltage, typically a short to voltage somewhere in the heater circuit.
Mode 6 O2 Sensor Test Results
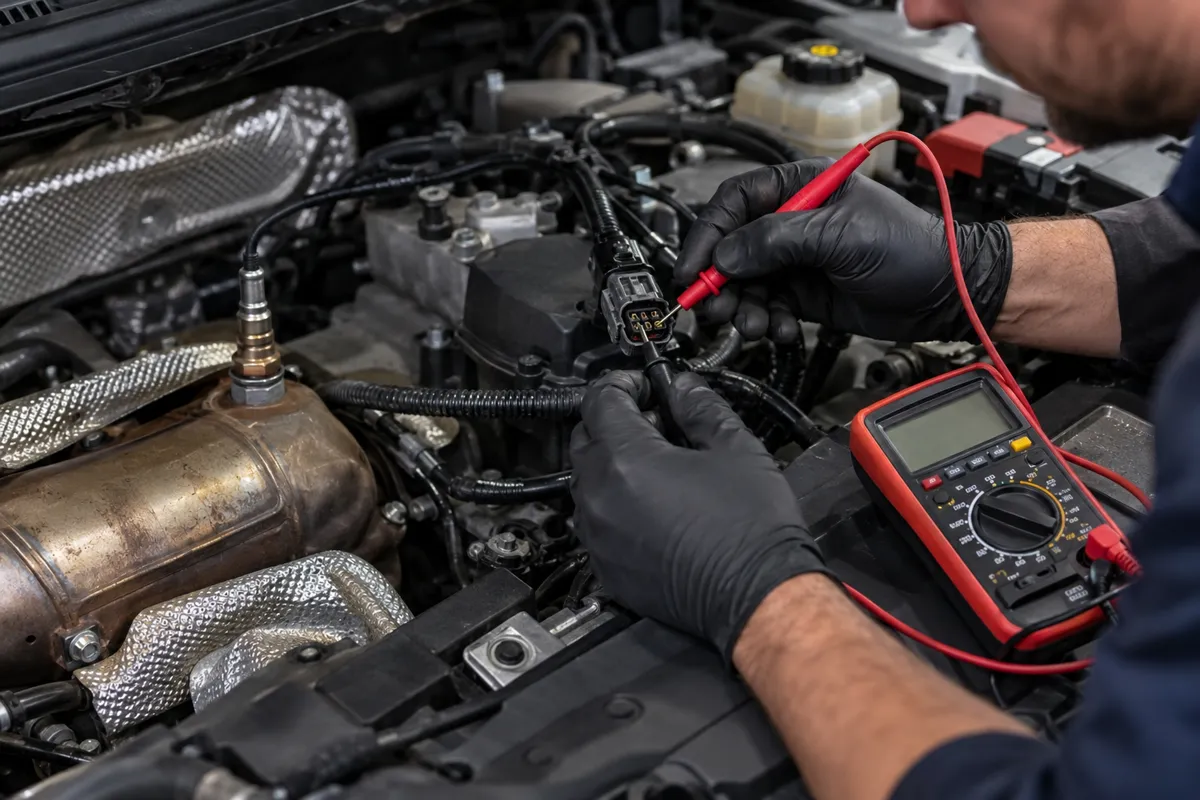
Mode 6 provides non-continuous monitor test results, including the results of the ECU’s own O2 sensor response time test, O2 sensor switching test, and catalyst efficiency test. Not all scanners display Mode 6 in a human-readable format. Those that do show each test ID (TID), component ID (CID), measured value, minimum threshold, and maximum threshold.
My obd2 mode 06 explained monitor test results covers this step by step.
My obd2 mode 6 explained how to use for diagnosis covers this step by step.
I cover this capability in more detail in my OBDLink MX+ review.
The O2 sensor response test measures how quickly the sensor transitions from lean (0.1 V) to rich (0.9 V) and back. The test ID and thresholds vary by manufacturer, but the general structure is: measured response time in milliseconds, with a maximum acceptable time (for example, 100 ms). A sensor that exceeds the maximum threshold in Mode 6 is failing the ECU’s own response test even if no DTC has confirmed yet, because the threshold for Mode 6 is tighter than the threshold that triggers a code.
To access Mode 6 on most scanners: navigate to Special Functions or OBD2 Mode menu, select Mode 6 or On-Board Monitoring. Select Bank 1 Sensor 1 (TID $01 on many vehicles). The result shows measured values alongside pass/fail indicators. A fail on the response time test or the rich-to-lean switching test with values approaching but not exceeding the DTC threshold is an early warning of a sensor that will fail the monitor on the next driving cycle.
Which O2 Sensor DTCs Mean What
The DTC structure for oxygen sensors follows a consistent pattern. P01xx codes from P0130 to P0167 cover the standard O2 sensor circuits. P0130 through P0135 cover Bank 1 Sensor 1: P0130 is a circuit malfunction (voltage out of range), P0131 is low voltage, P0132 is high voltage, P0133 is slow response, P0134 is no activity detected, P0135 is the heater circuit. P0136 through P0141 repeat the same pattern for Bank 1 Sensor 2.
I explain this in more detail in my my guide on check used car.
P0150 through P0167 cover Bank 2 sensors in the same sequence. P0171 and P0172 are system lean and rich on Bank 1, often caused by an upstream O2 sensor problem but not directly an O2 sensor circuit code. P0174 and P0175 are the Bank 2 equivalents. These lean/rich codes point to the fuel system response rather than the sensor circuit itself, though a slow or failed sensor can cause them by providing bad data to the fueling algorithm.
I explain this in more detail in my how to use an obd2 scanner.
Wideband sensor codes appear in the P2195 to P2199 range and the P2A00 to P2A03 range on vehicles that use wideband sensors. P2195 is “O2 Sensor Signal Biased/Stuck Lean, Bank 1 Sensor 1” and P2197 is the Bank 2 equivalent. These codes indicate the wideband sensor output is fixed on the lean side rather than varying around lambda 1.0. P2A00 is a closed-loop performance code indicating the wideband sensor is not providing enough correction authority to maintain stoichiometry.
I explain this in more detail in my can you drive with check engine light on.
Step-by-Step Test Sequence
Start with a cold engine. Connect the scanner and navigate to Mode 1 live data. Select all O2 sensor PIDs plus STFT and LTFT for each bank. Start the engine and watch the heater duty cycle rise for each sensor. Confirm all upstream sensors show heater activity within the first 30 seconds.
I explain this in more detail in my what obd2 scanner cannot detect.
Allow the engine to reach full operating temperature, approximately 10 to 15 minutes of driving or sustained idle with the heater off. Return to the Mode 1 data stream at idle. Observe each upstream sensor for 90 seconds. Count switching cycles. Note voltage range: does it fully reach 0.1 and 0.9 volts? Note STFT on each bank: is it within plus or minus 5%?
Check Mode 6 if your scanner supports it. Navigate to the O2 sensor test results for Bank 1 Sensor 1 and Bank 2 Sensor 1. Note any test values that are close to their thresholds even if they show a pass. A test result at 80% of the maximum allowed threshold is not failing yet, but it is a degrading sensor.
Read any stored DTCs and pending codes. Pending codes in the O2 sensor range indicate the monitor ran and detected a problem on one drive cycle but has not yet confirmed on a second. Pending codes often precede confirmed codes by one to three drive cycles and are the earliest DTC-level warning the scanner can provide.
My my guide on verify repair fixed obd2 covers this step by step.
FAQs
Can a cheap OBD2 scanner test O2 sensors?
Any OBD2 scanner that reads Mode 1 live data can show O2 sensor voltage and switching activity, which covers the most important part of the test. Mode 6 data, which shows the ECU’s own test results with pass/fail thresholds, requires a scanner that explicitly supports Mode 6 OBD2. Most scanners in the $50 to $150 range show Mode 6 in some form. A basic $15 code reader shows DTCs but no live O2 data and no Mode 6 results.
What should O2 sensor voltage be at idle?
A narrowband upstream sensor at warm idle in closed-loop should oscillate continuously between approximately 0.1 and 0.9 volts. It should not sit at a fixed voltage. A downstream sensor on a healthy catalyst should sit relatively stable near 0.5 to 0.7 volts with minor slow variation. A wideband upstream sensor shows a lambda value near 1.0 with narrow variation.
How do I know if my O2 sensor or my catalytic converter is bad?
Compare upstream and downstream sensor behavior in live data. If the upstream sensor switches normally (fast, full range) and the downstream sensor also switches rapidly at nearly the same rate, the catalyst is failing. If the upstream sensor is slow or stuck and the downstream sensor is stable or behaving oddly, the upstream sensor is the primary fault. A P0420 or P0430 code with a normally switching upstream sensor and an actively switching downstream sensor points to the catalyst.
Does the O2 sensor need to warm up before testing live data?
Yes. An O2 sensor only produces meaningful voltage data after reaching approximately 600°F (315°C). In the first minute after cold start, the heater circuit warms the sensor and the ECU operates in open-loop: ignoring O2 sensor input and using a fixed fueling map. Meaningful live data for the voltage switching test requires the engine to reach full operating temperature, typically after 10 to 15 minutes of driving. Testing before warm-up shows the sensor inactive or producing flat signals that do not reflect its actual condition.
What causes an O2 sensor to fail?
The most common cause is age and heat exposure: the sensing element degrades after 60,000 to 100,000 miles in most vehicles, producing slower response times before it fails completely. Contamination from coolant leaks (head gasket failure causes white exhaust), oil burning (worn rings or valve seals), or silicone sealant used near the exhaust also damages the sensing element. Heater element failure is independent and often happens before the sensor itself fails, typically caused by repeated thermal cycling rather than contamination.
Can I drive with a bad O2 sensor?
A failed upstream sensor forces the ECU into open-loop fueling mode, where it uses fixed fuel maps without real-time sensor feedback. The engine runs richer than necessary, fuel economy drops 10 to 20%, and the catalyst faces increased hydrocarbon load. Driving indefinitely with a failed upstream sensor risks damaging the catalytic converter over weeks to months. A failed downstream sensor has no direct effect on fueling and does not damage other components, but it prevents the catalyst monitor from running and causes an emissions test failure.
Why does my scanner show O2 sensor voltage stuck at 0.45 volts?
A voltage fixed at 0.45 volts is the default mid-range output from an oxygen sensor circuit when the ECU is not receiving a valid signal from the sensor. This is sometimes called a “biased” or “lazy” reading and indicates either the sensor is not at operating temperature yet, the sensor has failed with its output defaulting to the midpoint, or the heater circuit has failed and the sensor never fully warms up. Check the heater duty cycle PID alongside the voltage to distinguish between a cold sensor and a sensor with a failed heater.