
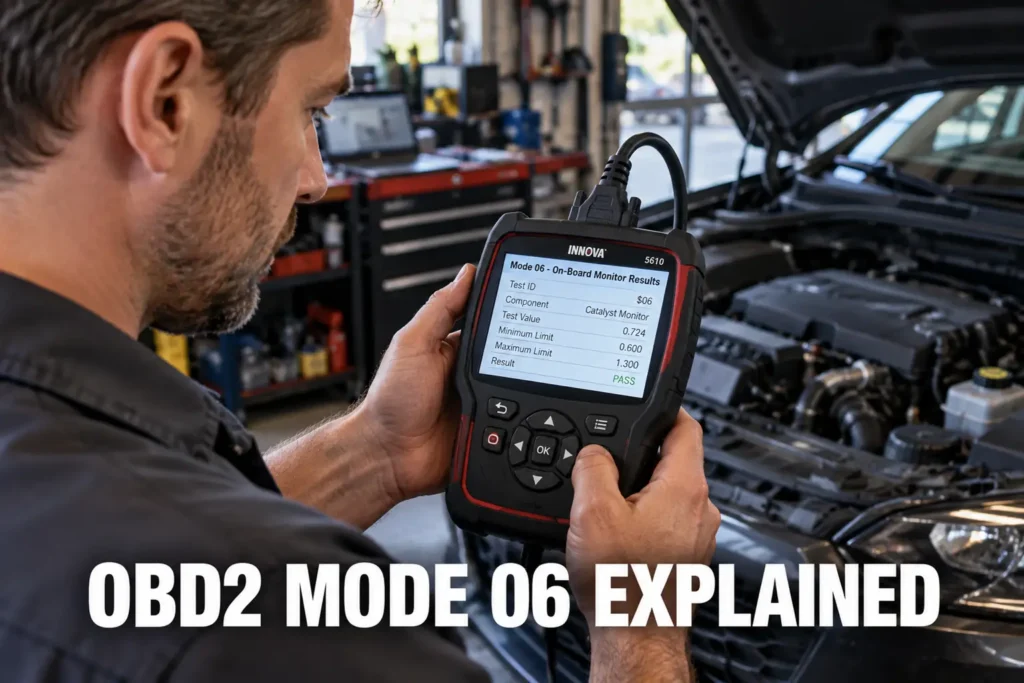
OBD2 Mode 06 Explained: Non-Continuous Monitor Test Results
By Kamil Siegień / October 12, 2026
Most OBD2 users interact with Mode 01 (live data), Mode 03 (stored fault codes), and Mode 04 (code clear). Mode 06 is far less commonly used but provides a layer of diagnostic detail that the other modes do not: it shows the actual test results from the ECM’s non-continuous monitor tests, including the measured value, the minimum limit, and the maximum limit for each test. Understanding Mode 06 data allows a technician to see how close a component is to failing its test before it actually fails and stores a code. A catalyst that is one drive cycle away from P0420, an oxygen sensor that is borderline slow, or an EVAP system with a marginal seal — all show up in Mode 06 data before they cause a check engine light. This guide explains what Mode 06 is, how to read its data, and which tests are most useful in practice.
My my guide on obd2 mode 6 explained use for diagnosis covers this step by step.
For scanner recommendations to perform this type of work, see my top OBD2 scanner picks.

About the author: Hello! I’m Kamil Siegień, founder of OBD2 Scout. My diagnostic experience started with an engine rebuild on a 2014 Skoda Superb 1.8 TSI, where tuning from 160 to 222 hp required mastering live data and ECU behavior that basic code readers cannot handle. I am a former BMW and MINI employee and regularly use diagnostic scanners on my own Audi A4 2.0 TFSI.
This guide covers what Mode 06 data contains and how it is structured, how to access Mode 06 on different scanners, the standard TID assignments for each monitor type, which Mode 06 tests are most diagnostically useful, how to interpret the margin between measured value and limit, and how to use Mode 06 alongside Mode 01 for a complete picture.
Chevy owners looking for the right scanner should check my top-rated scanners for Chevy.
What Mode 06 Data Contains
OBD2 Mode 06 requests on-board monitoring test results for specific monitored systems. While Mode 01 shows current sensor values and Mode 03 shows whether a monitor passed or failed, Mode 06 shows the actual numeric result of the test and the pass or fail thresholds the ECM used to evaluate it. This gives three numbers per test: the measured value (what the ECM actually observed), the minimum limit (the lowest acceptable value), and the maximum limit (the highest acceptable value). The combination tells you not just pass or fail, but by how much margin.
For a scanner with active test capability, see my best active-test scanners.
A Mode 06 catalyst result showing: measured = 0.82, minimum = 0.80, maximum = 1.00 tells you the catalyst passed — but by only 2.5% margin above the failure threshold. On the next drive cycle under more demanding conditions, this same catalyst may produce a measured value of 0.78, fall below the 0.80 minimum, and store P0420. Without Mode 06, you see no check engine light and no codes. With Mode 06, you know the catalyst is within 3% of failure and should plan for replacement.
Toyota owners looking for the right scanner should check my top Toyota scanner picks.
Compare this to: measured = 0.96, minimum = 0.80, maximum = 1.00. This catalyst passed by a 20% margin — it has substantial remaining life. Mode 06 lets you distinguish a new catalyst from an aging one that is weeks from failing, without waiting for the code to appear.
Jeep owners looking for the right scanner should check my top-rated scanners for Jeep.
Each test is identified by a Test ID (TID) and a Component ID (CID). The TID specifies which type of test was run (O2 sensor response time, catalyst efficiency, EVAP leak test, EGR flow). The CID specifies which instance of that component the result applies to (bank 1 sensor 1, bank 2 sensor 1, close-coupled catalyst bank 1, etc.). Together, TID and CID uniquely identify a specific test result. A vehicle may have 15 to 30 individual Mode 06 test entries, each with its own measured value and limits.
If you are on a tight budget, my best value OBD2 scanners covers the top value picks.
How Mode 06 Is Accessed
Mode 06 is part of the OBD2 standard and is available on all compliant vehicles, but not all scanners implement it or present it usefully. Budget code readers in the $20-$60 range typically do not access Mode 06 at all. Mid-range handheld scanners ($100-$300) such as the Autel MX808, Launch CRP909X, and Innova CarScan Pro typically include a Mode 06 or “on-board monitor test results” section, though display quality varies considerably: some show decoded names and clear pass/fail status, while others show only raw TID hex numbers and raw values requiring a reference table to interpret.
For a professional-grade tool, my best shop-grade diagnostic tools covers the top options.
The Innova 3100i and similar entry-level scanners with Mode 06 access often display only the test status (pass or fail) without the actual measured values and limits — this is better than nothing but loses the quantitative margin information that makes Mode 06 genuinely useful. The Autel AL619 and MX808 generally display measured values and limits with decoded descriptions for common test IDs. Professional tools provide the most complete Mode 06 presentation with all TIDs decoded, clearly labeled, and with explicit margin indication.
Audi Q8 owners can find the right scanner in my Q8-compatible diagnostic tools.
Software-based OBD2 tools on a laptop or phone frequently provide better Mode 06 presentation than hardware-equivalent price-point scanners because the display is not constrained by a small screen. OBD Auto Doctor (Windows/Mac), Torque Pro (Android), and Car Scanner ELM OBD2 (iOS) all display Mode 06 data with decoded names for most common TIDs when combined with a compatible ELM327-based Bluetooth or WiFi adapter. For regular Mode 06 monitoring (checking catalyst margin after a long trip, for example), this software-based approach is often more practical than a dedicated handheld scanner.
My elm327 and what can it do explained covers this step by step.
Audi Q7 owners can find the right scanner in my best scanners for the Q7.
Some manufacturers use non-standard TID assignments in Mode 06, meaning a generic scanner’s TID description may not match the actual test implemented at that TID number. Toyota, Honda, and Ford all have some non-standard TID assignments. The safest approach: use a manufacturer-dedicated tool or a scanner with manufacturer-specific Mode 06 decoding for detailed analysis, and use generic Mode 06 access only as a preliminary screen for the standard TIDs that are most universally consistent.
Audi Q5 owners can find the right scanner in my top diagnostic tools for the Q5.
Standard Mode 06 TID Assignments
SAE J1979 defines a set of standard TIDs for Mode 06. The most important ones for common diagnostic scenarios:
I cover this capability in more detail in my BlueDriver Pro deep dive.
TID 0x01 — Rich-to-lean O2 sensor response time (bank 1, sensor 1): Measures how long the upstream oxygen sensor takes to switch from a rich voltage (above 0.6V) to a lean voltage (below 0.4V). Maximum limit (pass threshold) is the maximum acceptable response time in milliseconds. A new O2 sensor typically responds in 50-100ms. An aging sensor may take 200-400ms. The maximum limit varies by calibration but is typically in the 100-200ms range depending on the make and engine — close to those limits indicates a sensor nearing end of life.
TID 0x02 — Lean-to-rich O2 sensor response time (bank 1, sensor 1): The same measurement in the opposite direction. Lean-to-rich response is often faster than rich-to-lean because the sensor design makes the lean-to-rich transition slightly more immediate. Both TID 0x01 and 0x02 together characterize the sensor’s full response capability.
TID 0x21 — Catalyst efficiency (bank 1): The primary TID for catalyst health. The measured value is a normalized efficiency ratio or storage efficiency metric. Higher is better. The minimum limit is the failure threshold. This TID is the reason Mode 06 exists in the minds of most technicians who know about it: it is the earliest warning of P0420 before the code stores.
I cover this capability in more detail in my Innova 3100RS deep dive.
TID 0x22 — Catalyst efficiency (bank 2): Same as TID 0x21 for the second bank on V6/V8/V10 engines. On a V6 with two separate converters and two separate O2 sensors per bank, both TID 0x21 and 0x22 should be checked: a vehicle may have a healthy bank 1 catalyst and a failing bank 2 catalyst with P0430 imminent.
TIDs 0x31 through 0x3C — EVAP system tests: Multiple TIDs cover different aspects of the EVAP monitor: gross leak test (fuel filler cap, vent hose), small leak test (0.020″ orifice equivalent), purge flow test, and vapor concentration test. The specific TIDs implemented vary by manufacturer. A borderline EVAP result — measured pressure decay close to the limit — is the Mode 06 early-warning signal for an EVAP system approaching P0456 (small leak) or P0455 (gross leak).
I explain this in more detail in my can you drive with check engine light on.
TIDs 0x25 and 0x26 — EGR flow tests: EGR commanded versus measured flow rate. The measured value is a flow metric and the limits define acceptable deviation between commanded and actual flow. Growing deviation over time indicates increasing EGR valve restriction or carbon buildup on the EGR valve or passages.
The Most Diagnostically Useful Mode 06 Tests
Catalyst efficiency (TID 0x21): This is the Mode 06 test that most directly saves money for vehicle owners. P0420 (catalyst efficiency below threshold) is one of the most expensive repairs on a modern vehicle: a quality OEM-equivalent catalyst for a popular make typically costs $200-$800 in parts alone, plus labor. Mode 06 allows you to track catalyst health decline over successive checks. If the efficiency ratio drops from 0.94 to 0.91 to 0.87 across three checks over six months, you can plan the replacement before the code appears rather than being surprised by a check engine light at an inconvenient time. Conversely, after a catalyst replacement, Mode 06 confirms the new catalyst is performing well above the minimum limit — providing objective evidence the replacement was successful and the correct part was used.
I explain this in more detail in my check engine light on but no codes stored.
O2 sensor response time tests (TIDs 0x01, 0x02, 0x05, 0x06): Oxygen sensor replacement is often recommended by mileage alone (100,000 miles is a common rule of thumb for upstream sensors). Mode 06 response time data provides an objective basis for this decision: a sensor showing response times at 70-80% of the maximum limit is aging but has remaining service life. A sensor at 95% of the maximum limit is near the end of its acceptable range and warrants replacement. After replacing a sensor, the response time should drop to well below the limit (typically 20-40% of the maximum) on a new OEM sensor — a new sensor reading close to the limit suggests either a non-OEM sensor with lower performance or an incorrect part number.
I explain this in more detail in my my guide on check used car.
EVAP leak test results: The EVAP monitor’s pass or fail status in Mode 01 tells you the system either held pressure above the leak limit or did not. Mode 06 EVAP data shows the actual measured pressure differential or flow rate and how it compares to the limit. A system that passes the small-leak test with only a 5% margin above the minimum acceptable pressure is more likely to fail under warm-weather conditions (when fuel vapor pressure is higher) than one passing with a 40% margin. This marginal pass behavior is the Mode 06 signal to inspect EVAP system seals and connections before the code appears.
Audi owners looking for the right scanner should check my top-rated scanners for Audi.
Interpreting the Margin Between Measured Value and Limit
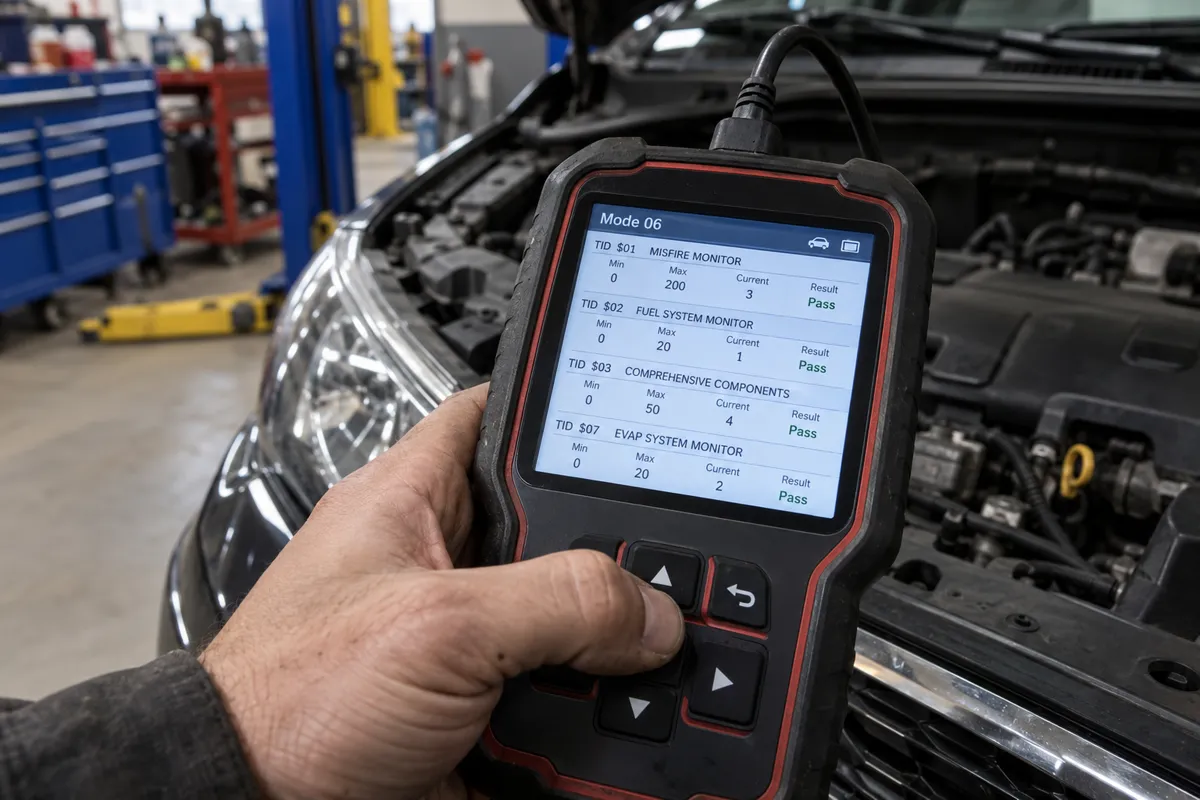
Reading Mode 06 data correctly requires understanding which direction of the limit indicates failure for each specific test. For catalyst efficiency (higher is better): the minimum limit is the failure threshold, and the measured value must be above it. For O2 sensor response time (faster is better, meaning lower time value): the maximum limit is the failure threshold, and the measured value must be below it. Confusing these directions leads to misinterpretation of the data.
I explain this in more detail in my my guide on use an.
A practical framework for evaluating Mode 06 margin: calculate the margin percentage as (measured – limit) / (scale of test) × 100. For catalyst efficiency with measured = 0.87 and minimum limit = 0.80: margin = (0.87 – 0.80) / 0.80 × 100 = 8.75%. For O2 sensor response time with measured = 145ms and maximum limit = 200ms: margin = (200 – 145) / 200 × 100 = 27.5%. A 27.5% margin on a response time test means the sensor is performing at about 72.5% of the maximum allowed response time — it is aging but not imminent. An 8.75% margin on catalyst efficiency means the converter is close to the failure threshold and warrants attention.
Season and driving conditions also affect Mode 06 results. A catalyst efficiency test result from a cold winter day when exhaust temperatures are lower may be slightly worse than the same vehicle tested in summer. EVAP test results are more stringent in warm weather when vapor pressure increases. When tracking Mode 06 values over time, compare results from similar conditions rather than comparing winter to summer readings directly.
Honda owners looking for the right scanner should check my top-rated scanners for Honda.
Mode 06 Versus Mode 01 for Diagnosis
Mode 01 live data shows what sensors are currently reading in real time. Mode 06 shows the result of a specific formal test the ECM ran under controlled conditions during a recent drive cycle. These are complementary diagnostic approaches, not interchangeable ones. Mode 01 is better for diagnosing active symptoms, real-time behavior under specific conditions, and sensor response during a dynamic event. Mode 06 is better for evaluating whether a component passed its formal ECM test and what margin it has before failure.
The most effective combined approach for catalyst evaluation: check Mode 06 catalyst efficiency after a complete drive cycle (confirms whether the formal monitor ran and what result it produced), then read Mode 01 live data to watch upstream and downstream O2 sensor behavior in real time at cruise speed (confirms the sensor switching pattern that the monitor evaluates). If Mode 06 shows a marginal pass and Mode 01 shows the downstream sensor switching nearly as rapidly as the upstream (indicating poor catalytic activity), both data sources agree the catalyst is degraded. If Mode 06 shows a marginal pass but Mode 01 shows the downstream sensor is relatively flat (indicating some catalytic activity), the Mode 06 result may represent an unusually challenging test condition rather than consistent degradation.
Limitations of Mode 06
Mode 06 data is only valid after the associated monitor has completed at least once since the last code clear or battery disconnect. If a monitor shows “incomplete” in Mode 01 readiness status, Mode 06 may show the previous test result (from before the code clear), a manufacturer-defined default value, or simply no data for that test. Always confirm Mode 01 readiness status for the relevant monitor before relying on Mode 06 results: a Mode 06 catalyst efficiency result is only meaningful if the catalyst monitor shows “complete” in Mode 01.
BMW owners looking for the right scanner should check my top-rated scanners for BMW.
Not all monitored systems have Mode 06 data in the standard format. Continuous monitors (misfire, fuel system, comprehensive component) run constantly without executing discrete test sequences: they do not generate single Mode 06 test result entries. Mode 06 is specifically for non-continuous monitors that run scheduled discrete test procedures with defined enabling conditions, start conditions, and completion criteria.
Ford owners looking for the right scanner should check my top-rated scanners for Ford.
The Mode 06 result reflects the most recent completed test run. If the monitor completed two weeks ago under mild conditions, the Mode 06 result reflects those conditions. A catalyst that tests marginally on a cold January morning may test more robustly on a warm summer highway drive when exhaust temperatures are higher. For the most relevant Mode 06 data, perform a complete drive cycle under conditions typical for how the vehicle is normally driven, then read Mode 06 immediately after.
FAQs
My scanner shows Mode 06 data but all the test IDs are just hex numbers. How do I know what each test is?
SAE J1979 Appendix C defines the standard OBD2 Mode 06 TID assignments. The key ones most scanners do not decode properly: TID 0x01 = rich-to-lean O2 sensor switching time (bank 1 sensor 1), TID 0x02 = lean-to-rich O2 switching time (bank 1 sensor 1), TID 0x05 = same for bank 1 sensor 2 (downstream), TID 0x21 = catalyst efficiency (bank 1), TID 0x22 = catalyst efficiency (bank 2), TIDs 0x31-0x3C = EVAP system tests. However, manufacturers sometimes place their own tests at standard TID numbers or use entirely non-standard TID assignments, so the SAE table is a starting point, not guaranteed. For accurate TID interpretation for your specific make, the factory service manual’s OBD2 diagnostic section lists the TIDs implemented and their descriptions for that make and model year.
Can I use Mode 06 to decide whether to replace an oxygen sensor before it fails?
Yes, and it is one of the most legitimate uses of Mode 06 data. A sensor showing response time at 75-85% of the maximum limit is aging noticeably but still within specification: replacement planning is reasonable. A sensor at 90-95% of the maximum limit will likely fail within the next inspection cycle or within a season of driving. One important caveat: confirm the Mode 06 test result is from a recently completed monitor run (check Mode 01 readiness first) rather than an old cached result from the last time the monitor ran weeks or months ago. The most meaningful Mode 06 sensor evaluation comes from a fresh result taken immediately after a complete warm drive cycle that included steady-state cruise.
Why does Mode 06 show a test as “passed” when I have a stored code for that system?
Mode 06 shows the most recent completed test result. It is possible for the monitor to have failed on a previous drive cycle (storing the code) and then run again more recently under favorable conditions and produced a marginal pass. This combination — a Mode 06 pass alongside a stored code for the same system — indicates a borderline component that sometimes passes and sometimes fails depending on conditions. This is exactly the intermittent or marginal fault pattern Mode 06 is best at revealing. The correct response is not to clear the code because Mode 06 shows a pass: instead, investigate the component that is oscillating between barely-pass and barely-fail, because the marginal Mode 06 pass value itself confirms the component is near the edge of acceptable performance.
My Mode 06 catalyst result has been the same for the past six months. Does that mean the catalyst is healthy?
A stable Mode 06 result over six months is a good sign, but its interpretation depends on the absolute value. A stable 0.95 with a minimum of 0.80 is an excellent sign: the catalyst is performing consistently well above the failure threshold. A stable 0.83 with a minimum of 0.80 is less reassuring: the catalyst is consistently near the failure threshold. One demanding drive cycle under high exhaust temperature conditions could push it below the limit. The stability of the reading matters less than the absolute margin. Monitor the trend over time: if the value has been 0.95, then 0.93, then 0.91 across three checks over six months, the downward trend predicts approaching failure even though each individual reading still passes comfortably.